library(ggplot2)
ggplot(diamonds, aes(x = carat, y = price)) +
  geom_point() +
  labs(title = "Scatter plot of Diamond Price vs Carat",
       x = "Carat",
       y = "Price (USD)")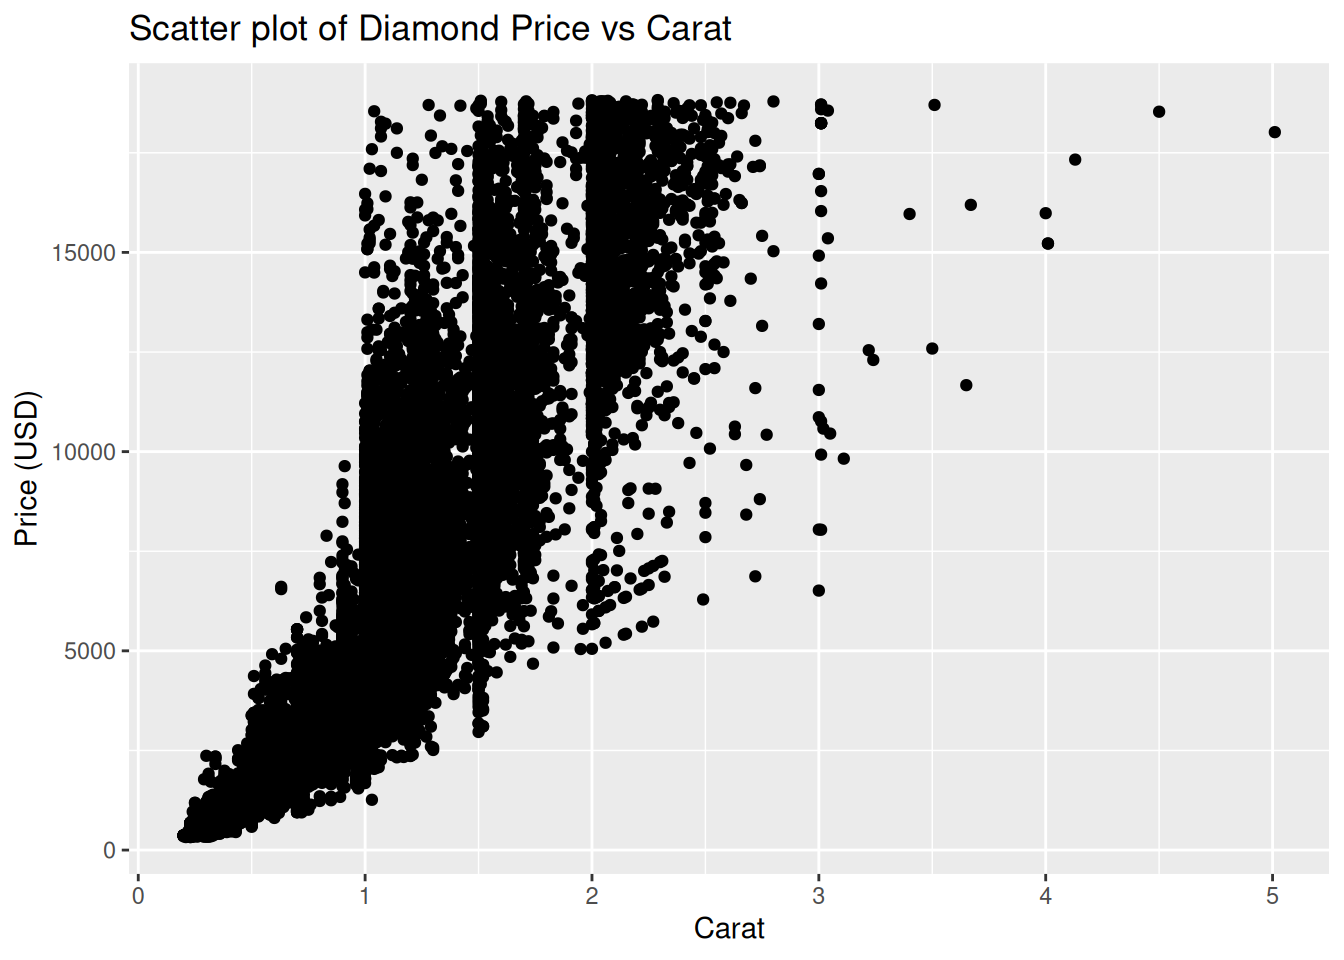
Sam Parmar
Here’s a plot of the diamonds dataset using ggplot2:
library(ggplot2)
ggplot(diamonds, aes(x = carat, y = price)) +
geom_point() +
labs(title = "Scatter plot of Diamond Price vs Carat",
x = "Carat",
y = "Price (USD)")